The keyword is currently being revised with regard to the latest figures for vineyards and wine production volumes...
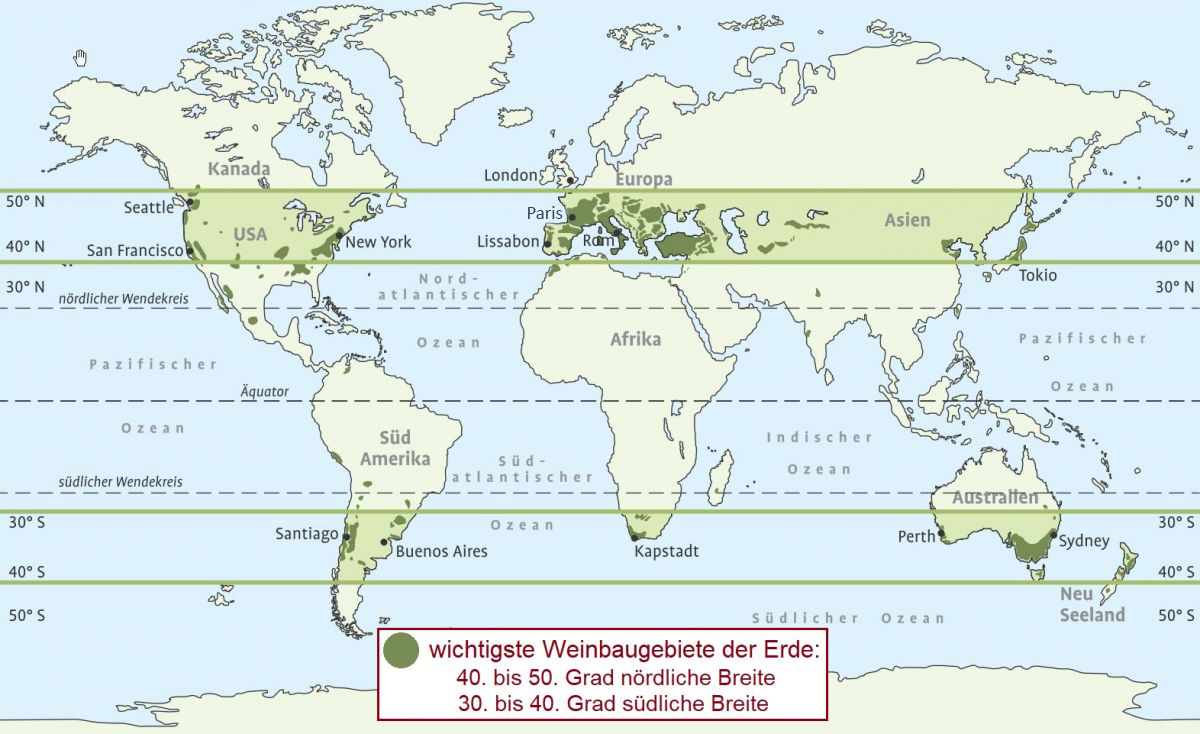
Grapes are grown in around 100 of the world's more than 200 countries. In most of them, wine is also produced from them to varying degrees. For the production of quality wine, certain conditions such as climate and soil type are required. The criteria for quality viticulture are called wine-growing suitability. The following information deals with the global area under vines and the global production of wine. The vast majority of vineyards are located in the vineyard belts from 40 to 50 degrees north and 30 to 40 degrees south:
After strong growth until the end of the 1970s, vineyards were in constant decline until the end of the 1990s, particularly in Europe. From the mid-1980s, the main reasons for this were the grubbing-up programme prescribed by the then General Secretary Mikhail Gorbachev (*1931) as a measure against alcoholism in the USSR, as well as the grubbing-up premiums in the European Union, which had a particular impact in Italy, France and Spain. The three-year period during which the EU granted premiums for the permanent abandonment of vineyards expired in 2011. Despite this, there was a global surplus production, meaning that around 5 to 10% more wine was produced than was consumed. Within the EU, there were therefore mandatory countermeasures such as forced distillation.
There was an increase again between 1998 and 2002, but since 2003 the global area under vines has been declining again, although grape production has increased. This is due to higher yields, particularly among Asian producers, where artificial irrigation is practised. In Europe, there was a reduction of 885,000 hectares (18%) between 2000 and 2012. The global area decreased by 221,000 hectares (3%) in these 12 years. There was strong growth in Asia, particularly in China and India with 377,000 hectares (27%) and America with 151,000 hectares (17%). In Asia, a significant proportion is destined for the production of products not processed into wine, particularly India, Iran, Turkey and Syria.
Vineyards
In terms of vineyards, a distinction is made between yielding area (from which grapes are harvested), planted vineyards (including areas not yet ready for harvesting) and total vineyard area (including unplanted fallow land). The following figures represent the planted vineyard area. The grapes are divided into wine grapes (wine grapes), table grapes and dried grapes for sultana production. In 2012, the total global volume of wine grapes was around 60%. The total area under vines in 2012, at 74,870 km², is roughly equivalent to Austria (84,000 km²) or one fifth of Germany (357,000 km²). The area under vines in 1,000 hectares compared between 2000 and 2012 (Oceania = Australia and New Zealand):
Wine production
In 2012, a total of 258 million hectolitres or 25.8 billion litres of wine were produced worldwide. This corresponds to 34.4 billion 0.75-litre bouteilles or a cube with a side length of 300 metres. Europe's high share of wine production (around two thirds) in contrast to the area under vines ("only" 55%) shows the higher proportion of table grapes and sultanas in other parts of the world on the one hand, and the lower yields and therefore higher quantities of quality wine in Europe on the other. Around a third of the wine volume was exported (see under wine trade). Wine production volumes in million hectolitres compared between 2000 and 2012:
Wine-growing countries
A list of countries ranked by vineyard area shows that the ranking by wine production is in some cases completely different. Turkey, for example, is only 32nd in terms of production, but 5th in terms of vineyard area. The reason for this is simply that table grapes or sultanas are predominantly produced there (also due to the ban on alcohol for devout Muslims). The biggest growth is in China, where the area under vines has tripled. Many major wine companies are investing there to avoid climate change - because China benefits from it.